Shutdown teams are commonly presented with fixed shutdown duration and a list of activities that cannot be completed in the time allowed. A method of ranking is therefore required such that those activities which have a low detrimental effect on the asset business plan, should they not get carried out, are only completed if schedule and resources allow.
To this end, a process of shutdown activity ranking process has been devised which ranks each activity based on the consequences of not carrying out a piece of work during the upcoming shutdown.
The process uses a proprietary piece of software called ‘SART’ (Shutdown Activity Ranking Tool). Once the activity list is felt to be mature, all activities are imported into SART. The order of activities is identical to that used on the activity list in order that ranking values can be directly transferred back to the activity list once the process has been completed.
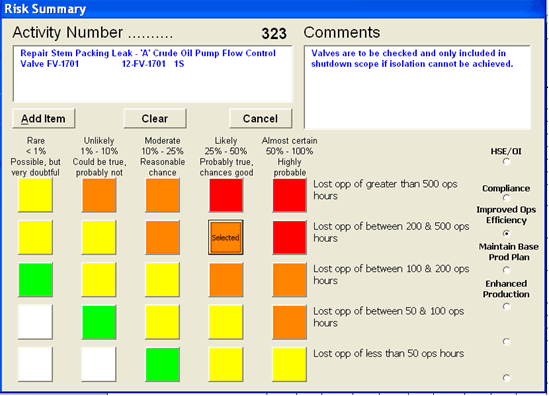
A workshop is then arranged (usually 1 day duration) which should, as a minimum, be attended by the shutdown coordinator, operations personnel, OIM, shutdown planner and any support personnel appropriate to the shutdown. During the workshop each activity is reviewed in turn and discussed to ensure full understanding of the reasons for it being included in the shutdown. Where it is decided that an activity does not require a shutdown (or may need only a partial shutdown such as water injection) or if further actions are required, notes are recorded in a free text field within SART. An assessment is then made of the probability and impact of not carrying out the activity during the proposed shutdown. This is done using a 5×5 matrix, an example of which is shown below.
The activity description (from the activity list) is shown in the top LH area. In this example it can be seen that there is an action to check isolations. Should solations hold then this activity may be done outwith the shutdown. To the right is a series of radio buttons. For each of these categories, a square within the 5×5 matrix is agreed and selected. This action enters a set of values into SART which contribute to a total activity value. Categories and definitions of category impacts are agreed prior to the workshop. They should reflect the asses’s current business case. An example is shown below.
| Extremely significant | Major significance | Moderate significance | Minor significance | Minimal significance | |
|---|---|---|---|---|---|
| HSE/OI 40% |
Loss of system integrity resulting in Prosecution. External reputation damaged internationally. Serious, permanent detrimental impact on environment. Extremely significant hydrocarbon release. Fatality, public enquiry or severe health effects. | Loss of system integrity resulting in Prohibition notice. Reputation damaged nationally. Permanent detrimental impact on the environment. Significant hydrocarbon release. Permanent disability, multiple hospitalisations or major health effects. | Loss of system integrity resulting in investigation by external regulator. Reputation damaged within industry. Detrimental impact on environment can be rectified. Moderate hydrocarbon release. One or more LTI cases or significant health effects. | Loss of system integrity resulting in company investigation. Reputation damaged within organisation. Minor detrimental impact on environment, can be rectified. Minor hydrocarbon release. Minor hydrocarbon release. RWI or minor health effects. | Loss of system integrity resulting in departmental investigation. Reputation damaged within department. Minimal detrimental effect on environment. Minimal hydrocarbon release. Medical treatment, first aid case or minimal health effects. |
| Compliance 25% |
Non compliance resulting in Prohibition order | Non compliance resulting in improvement notice | Non compliance resulting in scrutiny from external bodies | Non compliance resulting in internal Talisman investigation | Non compliance resulting in departmental scrutiny |
| Improved ops efficiency 10% |
Lost opportunity of reduction of greater than 500 ops hours over the period of a year | Lost opportunity of reduction of between 200 and 500 ops hours over the period of a year | Lost opportunity of reduction of between 100 and 200 ops hours over the period of a year | Lost opportunity of reduction of between 50 and 100 ops hours over the period of a year | Lost opportunity of reduction less than 50 ops hours over the period of a year |
| Maintain Base Production Plan 17.5% |
Greater than 1 month production loss per year | Between 1 week and 1 month production loss per year. | Between 3 days and 1 week production loss per year. | Between 1 day and 3 days production loss per year. | Less than 1 day production loss per year. |
| Enhanced Production 17.5% |
Lost opp of 20% or greater improvement in production up-time | Between 1 week and 1 month production loss per year. | Between 3 days and 1 week production loss per year. | Between 1 day and 3 days production loss per year. | Less than 1 day production loss per year. |
The percentages shown in red represent customisable ‘weightings’ given to each category. These figures also contribute to the final value for each activity.
Although the complete activity is imported into SART, it is common for some works to be unranked such as PSV (pressure safety valve) testing and MR’s (maintenance routines). It is normally felt that these will be carried out by small dedicated teams and therefore ranking is not required.
 Once the ranking workshop is complete, a spreadsheet is exported from SART for direct copy into the activity list. This includes the original activity description, any comments/actions recorded and the overall ranked score. A graph is also prepared which shows relative ranking scores. Depending on available resources (usually available people) a line can be drawn. Scopes above the line will be included in the shutdown and scopes below the line either deferred or deleted.


